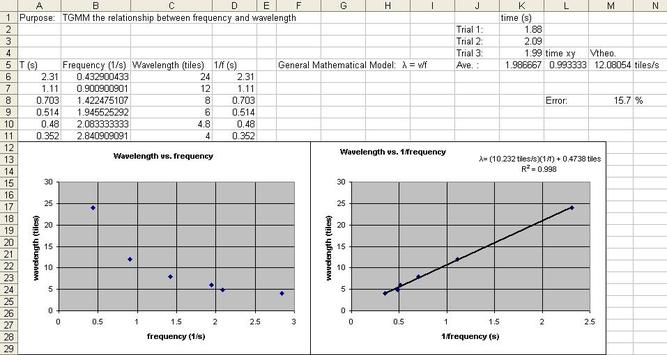
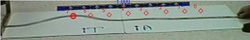
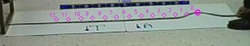
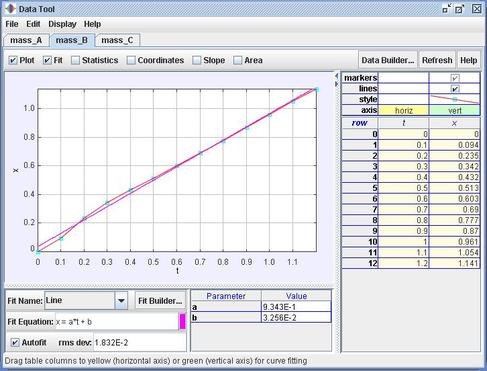
Equipped with a stop watch, large slinky and a hallway we determined the speed of a wave pulse and then with the same tension our purpose was TGMM the relationship between wavelength and frequency of wave. We measured the period and wavelength in floor tiles for several different harmonics of a standing transverse wave. The period was measured for 10 oscillations to determine the average frequency. We found an inverse relation as shown below.
0 Comments
We analyzed three videos of a wave pulse on a spring (High Tension & High Amplitude, Low Tension & High Amplitude, and Low Tension & Low Amplitude) to determine the relationship between wave pulse speed and amplitude and tension. High Tension & High Amplitude Low Tension & High Amplitude Low Tension & Low Amplitude In comparing the Low Tension High Amplitude to the Low Tension Low Amplitude we see that the amplitude has no effect on the speed of the wave (see below). Low Tension High Amplitude Low Tension Low Amplitude So we can see in the two graphs above that the slopes which are the speeds are about the same. In comparing the Low Tension High Amplitude to the Low Tension High Amplitude we see that the tension does have an effect on the speed of the wave (see below). Low Tension High Amplitude High Tension High Amplitude The slope of the High Tension graph above is higher indicating a higher speed. Therefore the speed of a wave is not a function of amplitude but it is related to tension and type of medium.
In today's lab we found the relationship between the period and the mass on a spring, the spring constant, and the amplitude of vibration. Rob Spencer said that we should provide students with stop watches and have students investigate the relationship between the period and amplitude first. Additionally, it would be wise to remind students of the different types of relationships they might encounter: direct, linear, top-opening, side-opening. It would also be a good idea to have a discussion of the circumstances that can arise which might at first glance cause someone to think a set of data represents a ________________ relationship when in fact it is a ________________ relationship and how best to discern what type of relationship it is. Students will have to find the relationship between period and mass. This is exceedingly difficult to do with small masses which are needed to make the relationship glaringly obvious. Students will also have to find the relationship between the period and the spring constant for about five springs. I like this part of the lab but again the exact relationship is more difficult to see at first glance as a large spring and small masses are needed. Lastly students will combine the relationships using the transitive property to find the relationship between all variables and all the data.
This article by Wenning, Holbrook, & Stankevitz gives make excellent suggestions specifically for science teachers to engage students during Socratic dialogues (whiteboarding).
Today we completed the collision lab using two photo gates and the vernier dynamics system. The relationship between Σpf and Σpi what investigated as well as the relationship between ΣEkf and ΣEki. All collisions were either with the magnetic ends in which case no sound was created during the collision or with the velcro side in which the two carts were stuck together after the collision. Although the data collected using the photo gates was exceptionally clean one problem arose when the masses were changed. When a mass was added to one cart the distance that the gate was blocked changed. This would be problematic for students to accomplish. Additionally for some collisions one of the photo gate would be blocked by two different widths. Therefore one of the velocity readings given by the program would be incorrect and would have to be changed. This would be too hard for most students. There are two things that are apparent from these two graphs: momentum can be positive and negative whereas Ek can only be positive, and momentum is conserved for all types of collisions even if energy isn't conserved.
We looked at the classic two carts explosion lab with a modeling twist. We didn't use any technology for data gathering (besides a vernier dynamics track & carts). We discussed all of the variables involved: 2 masses and 2 speeds. The discussion turned to how can we graphically relate one variable to another. We decided to plot the variable of the ratio of the speeds to the variable of the ratio of the masses. The data is displayed below. We end up with the relationship of Va/Vb = Mb/Ma which compares two things with two things. Cross multiplying we get a "one thing" product compared to a "one thing" product-- MaVa = MbVb. Thanks Rob.
Hugh added the idea of justifying the changing four variables into two with ratios by saying "lets double the mass, lets triple the mass, quadruple . . . hey lets make this easy and not look at masses per say but ratios of masses and while we are doing that lets use the ratio of the distances." The suggestion for talking the students to the vector nature is to look at the momentum before the explosion to see that it must be the same as after just like energy is conserved. I think next year after the energy unit and UCM I will present the students with a situation where ball bearings circulate around a central "heavy" object placed on a rubber sheet. I plan to ask them what factors effect the acceleration of the ball bearing toward the heavy object. I would try to illicit from them mass of central object (I would put in different massed central objects), distance to the center of the depression on the sheet, and the type of material the elastic sheet is made out of.
I will then present the purpose: TGMM the relationship between the a vs. r and a vs. Mo. Not sure if we can do this on an actual sheet of rubber or not but we could use Tycho Brahe's data to find the relationship with r. If we can't do it on a rubber sheet then at least qualitatively we can reason that a varies directly as Mo and so we would get a is proportional to Mo/r^2. Next I plan to have a class discussion to find the approximate mass of the earth (using Erastonthenes' R value for the Earth and assuming that the density of the earth is that of silicon dioxide) and finally the proportionality constant "G". Then I will either describe Cavendish's experiment or have the students perform the experiment to find the actual G and mass of the earth. I will also conclude the whole process by deriving Newton's form of Kepler's 3rd Law and compare this to the mathemat I learned that according to research written content-rich problems are just as effective learning tools as lab based ones. According to Ken we should be incorporating more of these in our teaching than mere plug and chug exercises. We need to be careful not to do the thinking for the students in these problems meaning we should leave it somewhat open to interpretation (slippery = frictionless ???) and we should not include pictures with the problem (that is a skill the students need to develop). These problems need to be directed toward the student (say "you want") and be motivational for them (something in their experiences or that they can imagine being in their experiences not made up just to give them a physics problem--my take on it).
I also learned that it really doesn't matter what we teach them in High School physics because in college they will assume the students know nothing. Therefore it is most important that we teach them how to think (be both divergent and convergent thinkers) and to keep them interested in physics. Hugh gave us the period and radius data for natural satellites in the solar system as well as the mass for each satellites' central body. Used this data to plot a vs. r and then a vs. Mo. After finding the relationship to be proportional to Mo/r^2, I plotted all of the satellite data of a vs. Mo/r^2 and found the proportionality constant, G.
I felt kind of funny doing it this way. I had no problem with a vs. r but the a vs. Mo. I would hope my students would say, "how do we know these are the masses?"---uh yeah, about that . . . well you see . . . It is one of those chicken and the egg things. If I could use the mathematical model for the universal law of gravitation then I could approximate the mass of the earth to get a round about number for G. But the only reason we want to get G is develop the mathematical model . . . now I really appreciate the genius of Newton. This feels very contrived. Should I . . . a) do this exact same lab and hope I don't get found out. b) replicate the a vs. r part and lead students through a discussion that it is logical to think that a is also related to the mass of the central body (different masses on a trampoline and the effects on a ball bearing's acceleration). I feel less guilty with option b) using planetary data instead of satellite only because I have a simulation. Additionally I would have the students find the relationship between the period and the radius (Kepler's law) and have them compare this to the harmonic relationships we found at the beginning of the year for a pendulum and in energy for a spring. So then the next question is should we replicate the Cavendish experiment using a modeling approach somehow or should I have the students approximate the value for G by solving for the mass of the earth (radius known, assume volume of a sphere and the density of sand) and using g = GM/r^2????? Really where am I going with this? I feel like this isn't really modeling anymore and that I'm back to quasi-lecturing and lobotomizing their creativity. Hmmmmmmm. Maybe I should just stop with the inverse square nature and have students investigate in real labs somehow other inverse square phenomena like light, sound, etc. I don't know. I'm just rambling now. Hugh Ross shared the slickest centripetal force lab I've seen that is really easy to do and is fairly cheap--I just need to get about 10 dual range force sensors. I really liked how we found the relationship between the net force and the radius and then with the mass non-quantitatively. After we figured out the relationships we then combined them to plot net force vs. m/r and guess what the slope was v^2! Very nice!
|
Archives
September 2017
Physics Blogs
|